


Better Than Bloomberg: The 15 Investment Tools That Will Make You a Better Investor
🧠 Bloomberg is great. But this toolkit is smarter, leaner, and (mostly) free...

Hi, Investor 👋
I’m Jimmy, and welcome to another free edition 🔓 of our newsletter. If you want to become a smarter, more independent investor, this edition is your digital toolkit.
Below, I’ve curated 15 essential tools for analyzing companies, tracking macro trends, and visualizing data - many of them free, and together more powerful than any single platform. Let’s dive in…
In case you missed it, here are some recent insights:
Subscribe now and never miss a single report:

The Bloomberg Terminal changed finance forever.
Back then, everything was physical - printed reports, phone calls, shouting on the trading floor.
Then Bloomberg came along, putting data, news, charts, and orders in one place. It became the global standard…
Today, it's still the go-to tool for asset managers. Second only to Excel.
But it comes at a cost - around $27,000 per year!!!
The good news? You don’t need it.
We’re living through the unbundling of Bloomberg.
Simpler, more focused (often free!) tools now deliver what really matters - and in many cases, do it better.
Here are the best ones (and how to use them).
🔎 Company Research & Valuation:
If you want to understand a business, you need more than numbers: you need clarity, context, and clean design…
Stock Analysis ⭐
Our top pick for company research. Stock Analysis strikes the perfect balance between depth and simplicity. It offers income statements, balance sheets, cash flows, valuation metrics, earnings calendars, analyst estimates, dividend trackers - all in an intuitive and ad-free interface. Ideal for everyday use.
TIKR.com
Global data coverage, peer comps, and 10+ years of fundamentals. Ideal for fundamental investors who want full visibility into company trends.QuickFS.net
Perfect for 10-year financial summaries and clean ratio breakdowns (ROIC, margins, etc.). A great companion for Buffett-style stock selection.OpenInsider
Tracks insider buying and selling activity with clarity and depth. A great tool to spot conviction moves from executives and board members - often a strong signal when paired with fundamental analysis.GuruFocus
Value-focused platform that shines in deep dives. Excellent for screening high-quality companies, spotting red flags, and tracking consistent dividend payers through a fundamental lens.

Enjoying the content? Help keep it coming - buy me a coffee for just $5.99 (that’s a 98% discount off its intrinsic value)!!!
🧠 Macro, Rates & Economic Indicators:
Understanding the big picture helps you avoid small mistakes - and sometimes, spot the big ones before they happen…
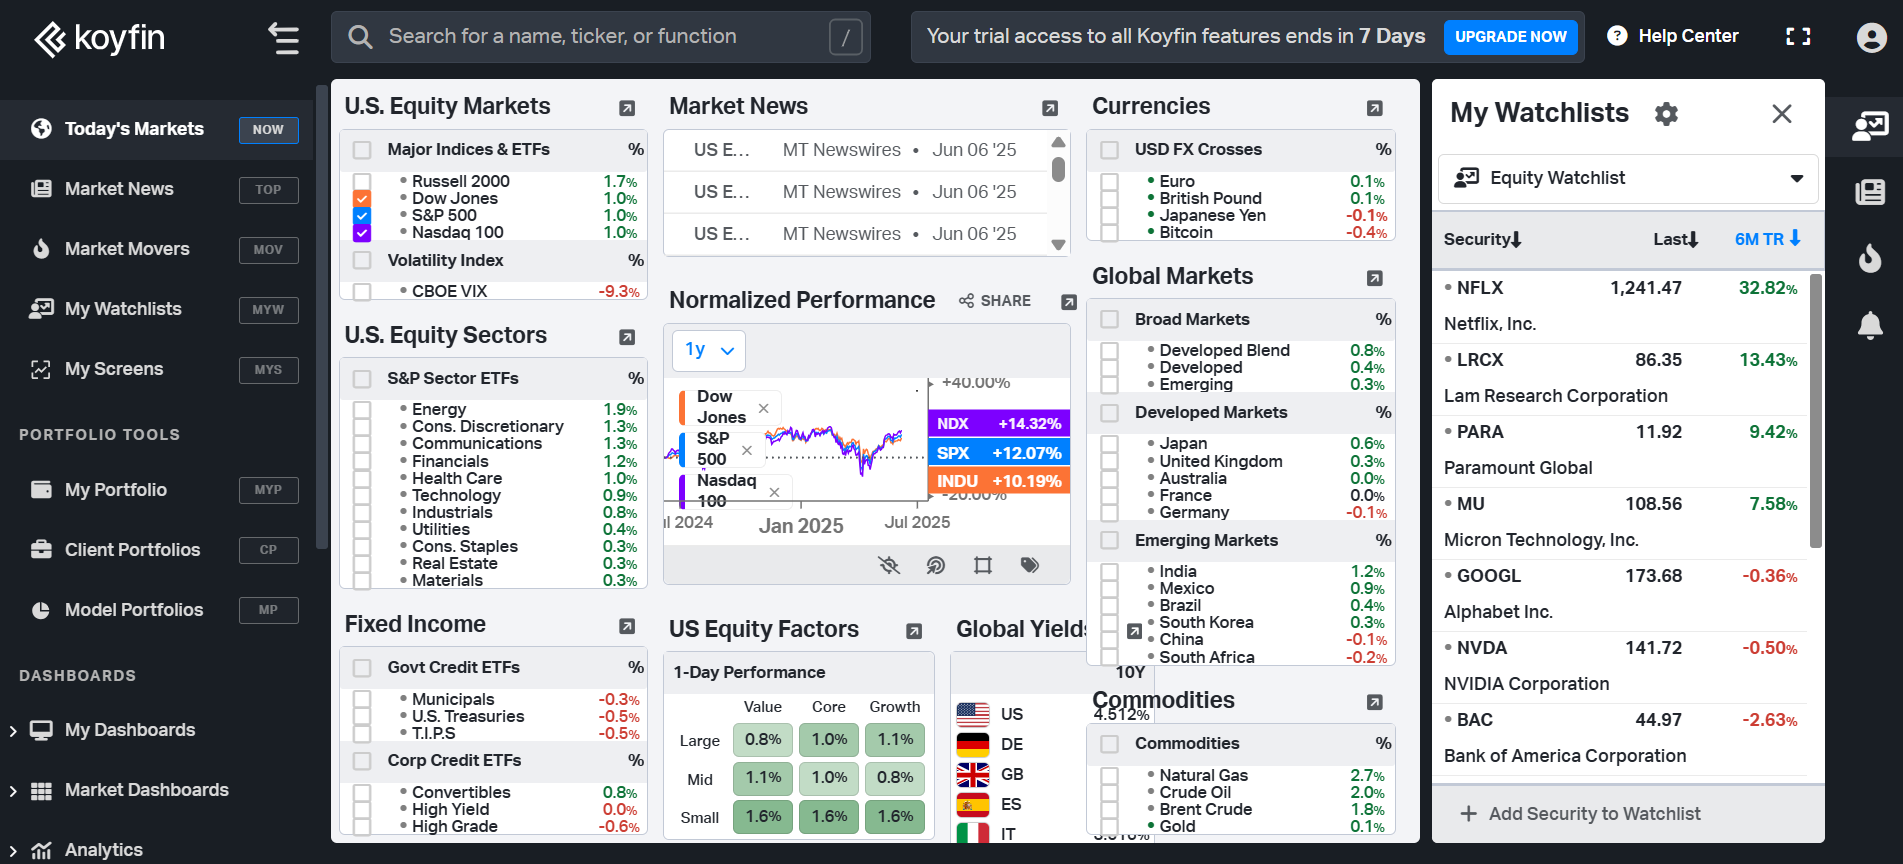
Koyfin.com ⭐
Far more than a stock tool - Koyfin is our top choice for macro tracking. Visualize yield curves, Fed expectations, sector performance, commodity trends, and more. It’s like having a Bloomberg terminal for charts, but in your browser and at a fraction of the cost.FRED
Federal Reserve’s official data portal. Clean access to rates, inflation, employment, and long-term historical charts.Trading Economics
Excellent macro dashboards by country. Keep track of GDP, CPI, PMIs, and fiscal health globally.World Bank Open Data
For institutional-level research across nations and decades - from poverty rates to energy consumption and education.MacroMicro.me
Connects macro data with market implications. Their thematic dashboards are brilliant for linking indicators to asset prices.
Found this content valuable? Share it with your network! Help others discover these insights by sharing the newsletter. Your support makes all the difference!
📈 Data Visualization & Market Sentiment:
If you can’t explain your investment thesis in under one minute, you probably don’t understand the company. And yes - charts can help…
Finchat.io ⭐
Yes, it’s AI - but with real financial depth. Finchat is the most fluid, dynamic visualization tool on the list. You can type questions like “Show me Apple’s gross margin trend” and get charts in seconds. It also explains metrics, generates summaries, and builds full company snapshots. Powerful for both learning and deep research.Finviz
A staple for heatmaps, screeners, and sector overviews. Also includes insider activity and performance filters.TradingView
Gold standard for technical charting, macro overlays, and community scripts. Great for active investors and data tinkerers.Portfolio Visualizer
Perfect for backtesting, portfolio allocation, and stress testing your strategy over different regimes.SentimentTrader
Focused on behavioral signals and sentiment extremes. Excellent for macro timing overlays.

Enjoying the content? Help keep it coming - buy me a coffee for just $5.99 (that’s a 98% discount off its intrinsic value)!!!
🎁 Final Gifts:
If you're serious about dividends, ETFs, or SEC filings, these three specialized platforms offer insights you won’t get elsewhere.
MarketChameleon
The go-to for dividend intelligence. Tracks payout changes, ex-dates, forward yields, and also brings options and volatility insights.ETF.com
A full-fledged ETF research platform. Analyze fund holdings, factor tilts, sector exposure, and thematic performance with clarity.EDGAR
EDGAR is the SEC’s online database where public companies file mandatory reports like 10-Ks, 10-Qs, and 8-Ks. It provides free access to financial disclosures, helping investors research companies and make informed decisions.
🚨 P.S.
Starting July 1st, our monthly plan jumps to $9.99/month - meaning a full year of access will soon cost nearly $120.
But right now, and only until June 30th, you can lock in the annual plan for just $59.99.
That’s 60% OFF! what future members will pay - and your rate stays locked!!!
The value we deliver every month - deep dives, mental models, frameworks, behavioral insights, real tools - is easily worth 10x that. And this is just the beginning.
✅ Commit now.
✅ Think better.
✅ Stay ahead - with us.
👉 Join the Annual Plan Before the Price Goes Up
✍🏻 Putting It All Together:
You don’t need a Bloomberg Terminal to invest well.
What you need is clarity - and the ability to connect the dots.
Each piece of data, each insight, each chart is part of a bigger puzzle.
When you combine the right tools, you build the full picture yourself.
Independent thinking. That’s what generates alpha.
Let me know which tools you already use - or which ones I should try next.
And if this list helps sharpen your edge, don’t forget to share it with a friend!!!
Thanks for reading this far.
Until next time,
Jimmy
Disclaimer
As a reader of Jimmy’s Journal, you agree with our disclaimer. You can read the full disclaimer here.
I’m not in USA and tried to subscribe but blocked and said Brazilian rules prevent my AMEX from being charged (I’m in Türkiye) … unsure I can get subscription by June 30
Thanks for the collection. As a margin of safety investor, stockrover is missing from the list.