


How to Analyze an Income Statement Like a Pro Investor
Learn to read income statements like a pro in just 9 minutes...

Hi, Investor 👋
I’m Jimmy, and welcome to another edition of our newsletter. Today, we’re breaking down how to analyze an income statement like a pro. Understanding revenue, costs, margins, and net income is essential for identifying high-quality businesses - and spotting red flags before it’s too late.
Let’s dive in! And as always, feel free to share this with fellow investors.
In case you missed it, here are some recent insights:
Subscribe now and never miss a single report:

The income statement is one of the most important financial reports a company produces.
It tells the story of how a business makes (or loses) money over time - often quarter by quarter or year by year.
If the balance sheet is the snapshot, the income statement is the movie…
And yet… for many investors, it’s one of the most misunderstood.
What do all those line items mean? How do professionals use this document to understand how well a company is truly performing?
In this guide, we’ll break it down step by step so you can read an income statement like a seasoned investor.
1. Understanding the Income Statement Structure
While the balance sheet gives you a snapshot of a company’s financial position at a specific point in time, the income statement (also known as the profit & loss statement or P&L) tells you how much money the company made (or lost) over a period.
At a high level, the income statement follows this formula:
Net Income = Revenue – Costs – Expenses
It begins with revenue - the “famous” top line - and ends with net income - the “even more famous” bottom line.
Everything in between gives you clues about the company’s operating efficiency, margins, cost structure, and strategic execution. That’s what you need to keep in mind.
Found this content valuable? Share it with your network! Help others discover these insights by sharing the newsletter. Your support makes all the difference!
2. Start at the Top: Revenue
The first thing you'll see is total revenue, usually broken down into two types:
Operating Revenue – money earned from the company’s core business.
For Dominos, it means pizzas; and
For Apple, this means iPhones.
Non-Operating Revenue – income from secondary sources, like interest, rent, royalties, or asset sales.
Watch out: non-operating revenue can boost earnings in the short term but is rarely sustainable.
It's also important to understand that a company's net revenue is the sum of all the different services it provides or products it sells.
If a company reports $150 million in revenue for a given quarter, it means it invoiced $150 million during that period - but it doesn't necessarily mean it received that amount in cash.
We'll talk more about that when we cover the cash flow statement... stay tuned.
3. Cost of Goods Sold (COGS):
Right below revenue, you’ll find Cost of Goods Sold (COGS) - the direct costs of producing goods or delivering services.
For a manufacturing company, this includes materials and labor. For software, it could be server and support costs.
The difference between revenue and COGS gives you the first key profit metric:
Gross Profit = Revenue – COGS
And its more important sibling:
Gross Margin = Gross Profit / Revenue
High gross margins (70%+) are typical in software or luxury brands. Low gross margins (10–20%) are common in retail or automotive - where scale is everything.
3.1. COGS and Inventory:
This line is directly tied to the inventory of certain business, and it's very interesting to understand how both relate to each other…
For example, If Walmart ($WMT) holds 1,000 items in stock, each purchased at an average cost of $5.00 - and it sells all of them within the same reporting period, then its COGS will be:
COGS = 1,000 items × $5.00 = $5,000
Ideally, the company sold those same items for, say, $6.00 each, generating:
Revenue = 1,000 items × $6.00 = $6,000
That would result in a gross profit of $1,000, or a gross margin of 16.7%.
This is how inventory and cost of sales work together - and why gross margin is a key measure of operational efficiency.
If Walmart manages its inventory poorly and fails to pass those costs through to customers, we’ll see it reflected in a margin decline…

Enjoying the content? Don’t miss out on more exclusive insights and analyses. Subscribe now and stay updated.
4. Operating Expenses:
Now we get into Operating Expenses - the costs of running the business. These are typically divided into:
SG&A – selling, general & administrative expenses (think salaries, rent, marketing)
R&D – research & development (key for tech and pharma)
Depreciation & Amortization – non-cash charges accounting for wear on physical assets or intangible investments
Subtracting these from gross profit gives you another key metric:
Operating Income (EBIT) – Earnings before interest and taxes.
Or even in EBITDA itself - which is simply EBIT plus depreciation and amortization (since depreciation had been subtracted earlier in the income statement).
This shows how profitable the company is from its core operations, before any financing costs or one-time items.
4.1. COGS and SG&A: What’s the difference, exactly?
While COGS is directly tied to the production of the final good, SG&A provides the structure that enables it to be produced and sold.
For a single Domino’s ($DPZ) franchise, for example:
COGS would be the pizza dough, cheese, and toppings.
SG&A would include the staff salaries, software systems, utilities, compliance costs, and so on.
In other words, COGS puts the product in the box, but SG&A keeps the lights on and the business running.

5. Financial Results:
This part of the income statement often flies under the radar - perhaps because the cost of debt over the past 15 years has been exceptionally low (especially given the era of quantitative easing QE we’ve experienced since 2008)…
But it has major implications for capital allocation and leverage strategy.
The section typically shows two lines:
Interest income: what the company earned on its cash and short-term investments.
Interest expense: what the company paid on its debt (interest only, no principal repayment).
Let’s break it down…
Imagine a company has $10 million in debt at an 8% annual interest rate. That means it will pay $800,000 per year in interest alone.
Now, what if it also has $10 million in cash?
Well… that cash might earn 4–5%, depending on market rates (usually very close to the Federal Funds Rate). So the same $10 million would generate maybe $400,000–$500,000 annually.
The difference is clear: debt is usually more expensive than cash earns.
So why would a company take on debt?
Because it believes it can reinvest that borrowed capital into projects that generate a return greater than the cost of debt.
This is the essence of leverage: borrowing money to amplify returns.
But here’s the catch - if those projects underperform, debt magnifies the downside, too.
Highly leveraged companies are especially vulnerable in downturns or when interest rates rise. That’s why understanding the cost of debt vs. return on capital is so critical.

If you subtract the financial result from EBIT, you're removing the “I” - for interest - from the equation, which gets you to EBT (Earnings Before Taxes) - the final step before net income.
Found this content valuable? Share it with your network! Help others discover these insights by sharing the newsletter. Your support makes all the difference!
6. Taxes:
Taxes show up more than once on the income statement - and in more ways than many investors realize.
Let’s walk through the layers.
6.1. Gross Revenue → Net Revenue
Before we even get to profits, companies subtract sales-based taxes from gross revenue. These are often invisible in U.S. GAAP reporting, but they reduce the top line.
Examples include:
State and local sales taxes
Excise taxes (e.g. alcohol, tobacco)
Import duties (if applicable)
6.2. Pre-Tax Income → Net Income
Further down the funnel, you’ll see income taxes - usually based on pre-tax earnings (EBT, which we mentioned just above)…
This is where the “effective tax rate” lives, and it can vary widely depending on:
Tax credits (e.g. R&D credits)
Loss carryforwards
International operations
Deferred tax accounting
7. Net Income, Finally:
After you’ve paid your suppliers, employees, lenders, and bankers - and left a slice for the government - you finally arrive at net income.
The ultimate goal of every company. “Earnings after everything”.
This is the famous bottom line.
It’s what ultimately flows into retained earnings on the balance sheet. And it will either be reinvested into the company or distributed to shareholders as dividends.
7.1. EPS (Earnings Per Share):
EPS is a metric derived from net income — it’s simply the net profit divided by the number of outstanding shares.
It’s especially useful for comparing a company’s earnings per share to its market price.
For example, if $DPZ is trading at $500/share and its EPS is $18/share, then its P/E ratio is:
📊 $500 ÷ $18 = 27.8x
That means investors are paying nearly 28 times current earnings for a share of Domino’s - a reflection of market expectations for future growth and profitability.
Enjoying the content? Don’t miss out on more exclusive insights and analyses. Subscribe now and stay updated.
8. Horizontal vs. Vertical Analysis:
Professional investors use two lenses to make sense of income statements beyond just the raw numbers: horizontal and vertical analysis.
8.1. Horizontal Analysis:
This method looks at how each line item changes over time - from quarter to quarter or year to year.
Questions you might ask:
Is revenue growing faster than expenses?
Are margins expanding or compressing?
Has interest expense ballooned faster than earnings?
This helps you spot trends and sustainability - not just one-time performance.
8.2. Vertical Analysis:
Vertical analysis expresses each line as a percentage of revenue. This gives you a clear picture of cost structure and profitability.
For example:
Gross margin = Gross profit / Revenue
Operating margin = Operating income / Revenue
Net margin = Net income / Revenue
Let’s say a company has:
$100M in revenue
$60M in COGS → 40% gross margin
$20M in operating income → 20% operating margin
$12M in net income → 12% net margin
This tells you where value is created - or lost - along the way.
Vertical analysis is essential for comparing companies of different sizes within the same industry. A $1B company with a 25% margin is more efficient than a $10B one with 15%.
9. What to Look For Like a Pro:
Want to read an income statement like a pro investor? Here’s your checklist:
Are revenues growing sustainably, or are there one-time gains inflating results?
Is gross margin improving or declining over time?
How efficient is the company at managing operating costs?
Are earnings driven by core operations or financial engineering?
What’s the EPS trend over several quarters?
Let’s take a real example…
Found this content valuable? Share it with your network! Help others discover these insights by sharing the newsletter. Your support makes all the difference!
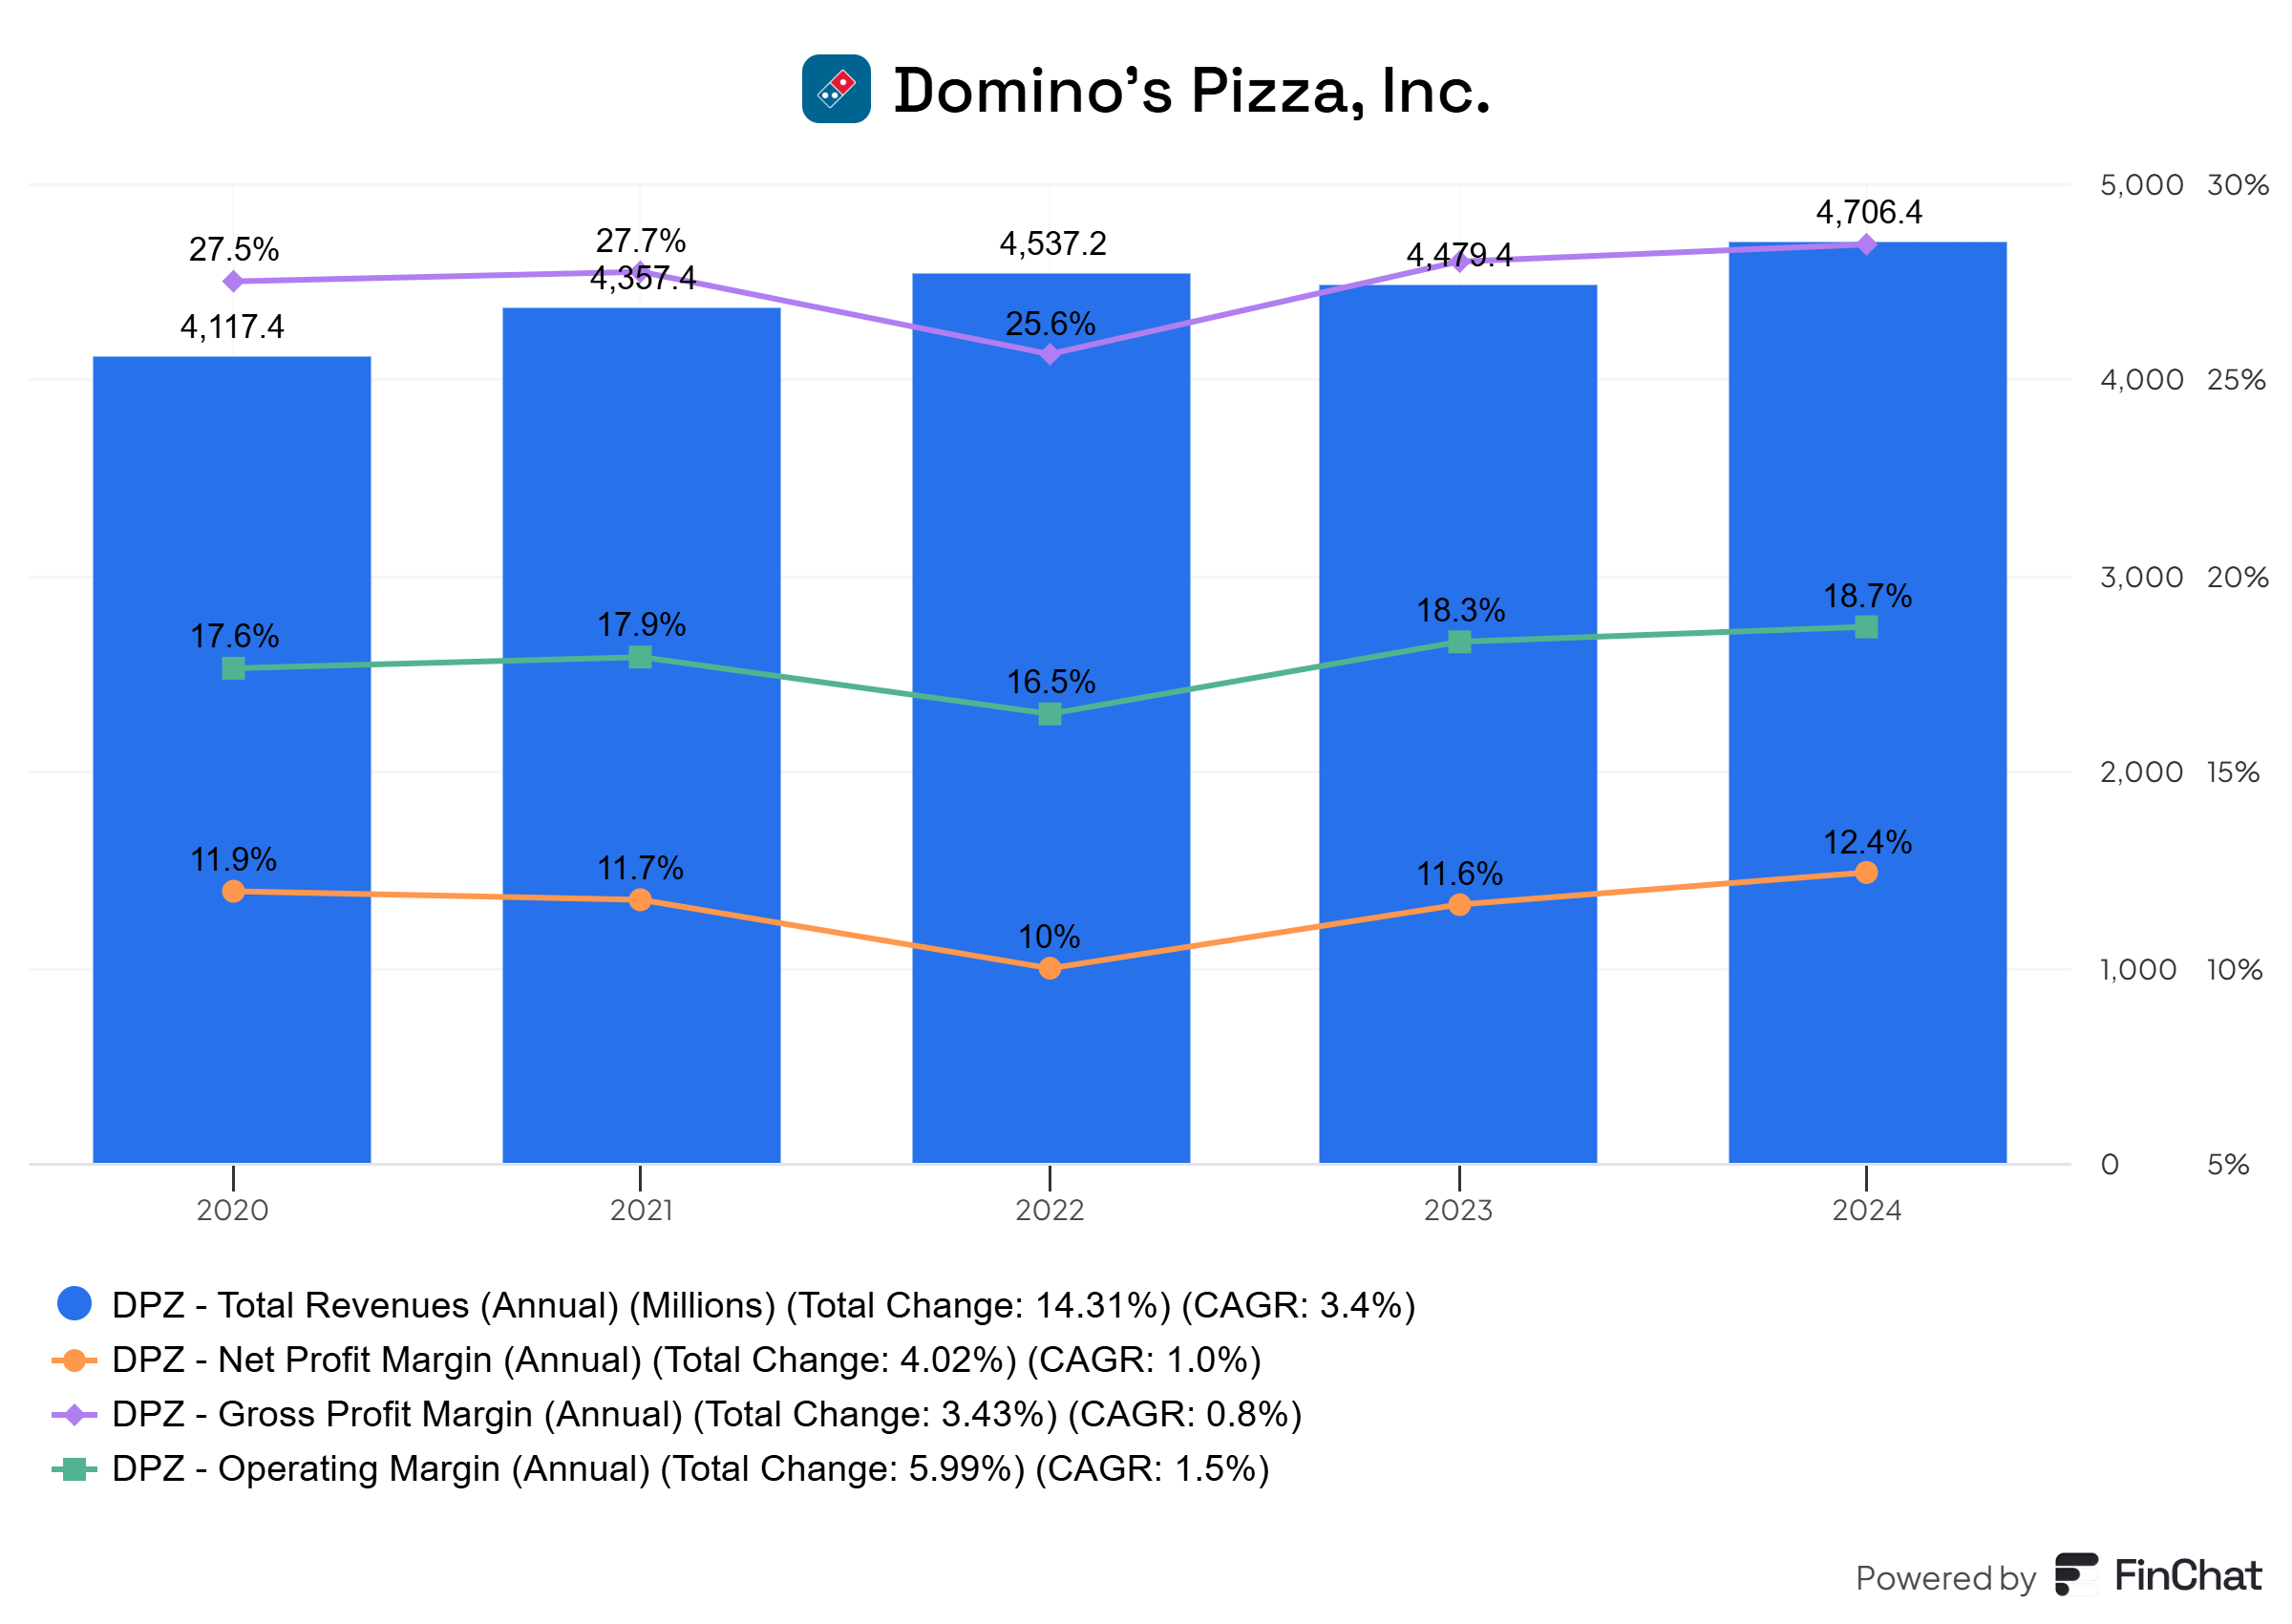
10. Practical Example: Dominos ($DPZ)
In recent years, Domino’s ($DPZ) has become an even stronger example of consistency and stability - and that shows clearly in its P&L (or income statement).
Take a closer look:
Net revenue has grown at a CAGR of 3% per year over the past five years -showing steady, inflation-aligned growth.
Gross margin has remained relatively stable (25-27%). That means even as the cost of pizza ingredients rose, Domino’s successfully passed those increases on to customers - a sign of strong pricing power.
Operating margin also held steady - which suggests Domino’s has likely found its ideal SG&A and staffing structure to support its operations efficiently.
Net margin has also hovered around 10–11% over the years — which tells us that Domino’s has kept its capital structure relatively stable during this period. And a consistent tax burden as well.

Notice that gross margin is relatively low - and that’s expected for a product with low added value.
People won’t pay significantly more for a pizza than what it costs to make. If the price gets too high, many would simply buy the ingredients and make it at home.
That’s the nature of commodity-like goods: pricing power is limited, and efficiency becomes everything.
11. Spot the Red Flags:
Professional investors are always on the lookout for signs of trouble:
Declining revenue or gross margins
Operating expenses growing faster than revenue
Big swings in “other income”
Large one-time gains masking a weak core business
Consistently low or volatile EPS
Remember, earnings can be “managed.” Look for trends - not just one great quarter.
Enjoying the content? Don’t miss out on more exclusive insights and analyses. Subscribe now and stay updated.
12. Final Thoughts:
The income statement is a story of what the company sells, how efficiently it operates, and whether its growth is sustainable.
Professional investors read that story between the lines. They don’t just look at the bottom line - they understand how the company got there.
Next time you look at a company’s earnings report, ask:
Are these profits real and repeatable?
Is the business getting more efficient or bloated?
Is management prioritizing long-term value or short-term optics?
With that mindset, you’re already halfway to reading income statements like a pro.
See you next time,
Jimmy
Disclaimer
As a reader of Jimmy’s Journal, you agree with our disclaimer. You can read the full disclaimer here.
Awesome piece Jimmy! Totally free of jargon or complexity that would put off non professionals. I'm going to share it with my readers.
This is a great article. As an accountant & investor I sometimes struggle to explain some of the meanings you have laid out here to friends in a way they can understand. You have laid them out so clearly that I'll have no issue sharing this with them in the future!