


How to Analyze a Balance Sheet Like a Pro Investor
Learn to read balance sheets like a pro in just 7 minutes...

Hi, Investor 👋
I’m Jimmy, and welcome to another edition of our newsletter. Today, we’re breaking down how to analyze a balance sheet like a pro. Understanding assets, liabilities, and equity is crucial for spotting strong companies and avoiding financial risks.
Let’s dive in! Feel free to share with fellow investors.
In case you missed it, here are some recent insights:
Subscribe now and never miss a single report:

The balance sheet is one of the most important financial statements for investors. It provides a snapshot of a company’s financial health at a given point in time.
But for many investors, it can seem intimidating…
What do all those numbers mean? And how do professional investors use them to make better decisions?
In this guide, we’ll break it down step by step so you can analyze a balance sheet like a pro.
1. Understanding the Balance Sheet Structure
The balance sheet is divided into three main sections:
Assets – What the company owns.
Liabilities – What the company owes.
Equity – The remaining value for shareholders after liabilities are subtracted from assets.
The fundamental equation that governs the balance sheet is:
Assets = Liabilities + Equity
This equation ensures that everything the company owns is accounted for, either through obligations (liabilities) or ownership (equity).

Found this content valuable? Share it with your network! Help others discover these insights by sharing the newsletter. Your support makes all the difference!
2. Examining Assets: How Strong Are They?
Assets are categorized into current and non-current (long-term) assets.
2.1. Current Assets:
These are assets that can be converted into cash within a year.
Key components include:
Cash and cash equivalents – It's cash sitting in a checking account or in very short-term products, such as Treasury bills. Immediate liquidity (D0).
Accounts receivable – Receivables derived from installment sales. It's almost a backlog. It is not exactly liquid, but it can be easily advanced in banking operations for a small interest fee (additionally, we need to keep an eye on delinquency, as it directly impacts this line).
Inventory – Goods available for sale, or the raw materials available for their production.
A healthy business should have enough current assets to cover short-term liabilities.
The higher your position in the asset, the greater its liquidity. In other words, cash is more liquid than receivables, which are more liquid than inventory – and so on.
Quick Reflections:
An interesting exercise is to calculate the average collection period and average inventory period.
Let's use Nike ($NKE) financials as an example...
Average Collection Period:
The calculation of the average collection period helps us understand how long, on average, Nike takes to convert its credit sales into cash.
The formula used is straightforward:

In 2021, Nike reported $44.5 billion in revenue and $4.4 billion in receivables. Applying the formula, we arrive at an average collection period of 35.6 days.
By 2024, revenue had increased to $51 billion, while receivables had decreased to $4.1 billion. The new average collection period is 28.9 days.
This represents a reduction of 6.6 days, indicating that Nike is converting its credit sales into cash more quickly - by being more restrictive in its credit policy, for example.
Average Inventory Period:
Now, let’s analyze the average inventory period, which measures how long, on average, the company takes to sell its inventory.
The formula follows the same logic:

In 2021, Nike had $6.8 billion in inventory and $24.5 billion in COGS. Applying the formula, we arrive at an average inventory period of 101.3 days.
By 2023, inventory had risen to $8.4 billion, while COGS reached $28.9 billion. The new average inventory period is 106.1 days.
In other words, by 2023, Nike took 106 days of sales to fully cycle through its inventory.
This reflects an "inventory-heavy" business model - less "on-demand" compared to trends in other sectors. However, this approach makes sense given the significant cost advantages of large-scale production.
Notice the negative externalities of this movement (higher inventory), such as (i) higher tied-up capital, (ii) the need to cut margins to reduce it quickly, and (iii) lower interest income (since idle inventory generates no returns).

2.2. Non-Current Assets:
These include long-term investments, property, plants, and equipment (PP&E), and intangible assets like patents and goodwill. While non-current assets contribute to long-term growth, they are less liquid.
Property, Plant & Equipment (PP&E) – These are the tangible, long-term assets used in operations, such as buildings, machinery, and land. Depreciation is applied to most PP&E items, reflecting their gradual wear and tear. Companies with high capital expenditures (CapEx) tend to have significant PP&E, which can be a sign of future growth or heavy reinvestment requirements.
Intangible Assets – These include intellectual property (patents, trademarks, copyrights), brand value, and goodwill. Unlike PP&E, intangibles do not have a physical form but can also be critical in generating long-term revenue. Goodwill arises in acquisitions and represents the premium paid over the fair value of acquired assets.
Long-term Investments – These are holdings in stocks, bonds, or other companies that the business does not intend to sell in the short term. They provide financial flexibility and can generate passive income, but their valuation fluctuates with market conditions.
What to look for?
Compare cash and receivables to short-term liabilities.
High inventory levels could mean slow sales or poor inventory management, AKA Nike ($NKE).
Check if intangible assets are overstated (I see many people analyzing a company's P/B right after an M&A, when goodwill is inflated. P/B is not useful in these situations).
Enjoying the content? Don’t miss out on more exclusive insights and analyses. Subscribe now and stay updated.
3. Analyzing Liabilities: Can the Company Handle Its Debt?
Liabilities are also divided into current (due within a year) and non-current (long-term obligations).
3.1. Current Liabilities:
These include:
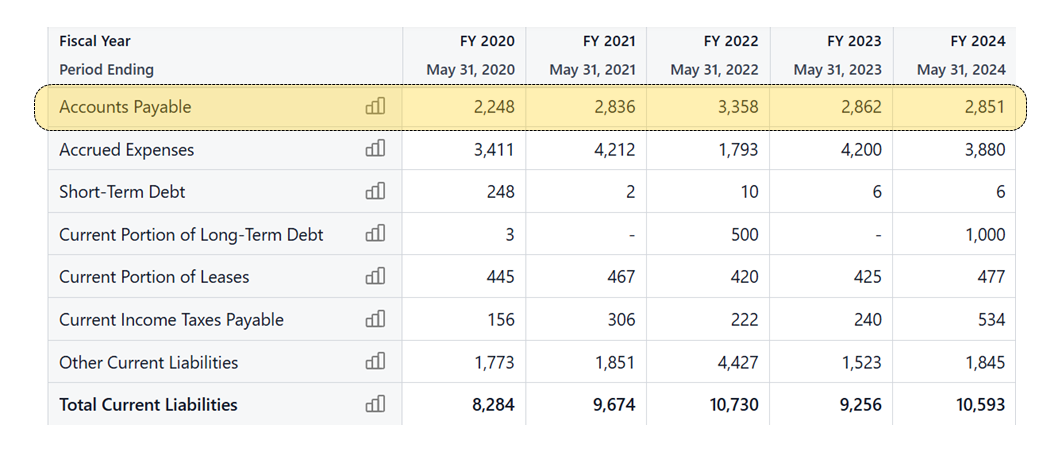
Accounts payable – Amounts owed to suppliers for goods and services already received. This is a short-term obligation that reflects the company's ability to manage its working capital. A high accounts payable balance could indicate strong supplier credit terms or potential cash flow constraints.
Short-term debt – Loans or credit lines that must be repaid within a year. These are typically used to finance short-term operational needs (working capital). High short-term debt relative to cash flow can indicate financial stress and refinancing risks.
Accrued expenses – Expenses incurred but not yet paid, such as wages, taxes, and utilities. These represent obligations that will soon require cash settlement. A growing balance of accrued expenses might indicate aggressive cost management or upcoming liquidity needs.
High current liabilities can signal liquidity risks if the company doesn’t have enough current assets to cover them.
Average Payment Period:
You can also calculate the average payment period for suppliers, following the same examples as before.
Nike had a COGS of $28.4bn in 2024, while accounts payable stood at $2.8bn.

This means that Nike's average payment period is 36 days.
3.2. Long-Term Liabilities:
Long-term debt – Bonds and loans that mature beyond one year. These financial obligations are typically used to fund capital investments, acquisitions, or expansion plans. While long-term debt provides companies with necessary capital, excessive reliance on it can lead to financial strain if interest rates rise or cash flows decline.
Pension obligations – Future payments promised to employees as part of retirement plans. These commitments are based on actuarial assumptions, such as life expectancy and investment returns.
Deferred tax liabilities – Taxes that a company has accrued but deferred to future periods due to temporary differences between financial reporting and tax regulations. These liabilities typically arise from depreciation methods, revenue recognition differences, or tax credits.
What to look for?
Check the Current Ratio: Current Assets / Current Liabilities (should be >1 for liquidity).
Review the company’s debt levels compared to cash flow.
Understand when debt is due and how it’s structured.
Found this content valuable? Share it with your network! Help others discover these insights by sharing the newsletter. Your support makes all the difference!
4. Evaluating Shareholder Equity: What’s Left for Investors?
Equity represents the residual value after liabilities are paid.
Key components:
Common stock & additional paid-in capital – Funds raised from issuing shares to investors. This represents the initial capital invested in the company and any additional amounts paid by investors above the nominal share price.
Retained earnings – Profits that the company has reinvested instead of distributing as dividends.
Treasury stock – Shares repurchased by the company but not canceled. These stocks are held in the company's treasury and reduce the number of outstanding shares in the market. T
What to look for?
Consistently growing retained earnings show profitability.
Negative equity can be a red flag.
Share buybacks may indicate confidence in future growth (or lack of opportunity)
5. Key Ratios to Analyze a Balance Sheet Like a Pro:
Ratios help investors quickly assess financial strength.
Here are the most important ones:
5.1. Liquidity Ratios:
Current Ratio = Current Assets / Current Liabilities (>1 is healthy)
Quick Ratio = (Current Assets - Inventory) / Current Liabilities (measures liquidity without inventory)
5.2. Leverage Ratios:
Debt-to-Equity Ratio = Total Debt / Shareholder Equity (higher means more leverage)
Interest Coverage Ratio = EBIT / Interest Expense (measures ability to pay interest on debt)
5.3. Efficiency Ratios:
Asset Turnover = Revenue / Total Assets (how efficiently assets generate revenue)
Operating Cycle = Average Inventory Period (AIP) + Average Collection Period (ACP)
Using these ratios, you can compare companies within the same industry and spot financial strengths or weaknesses.
6. Spotting Red Flags:
A balance sheet can reveal warning signs about a company’s financial health.
Watch out for:
Excessive debt: too much leverage can be risky in downturns.
Declining cash reserves: indicates potential liquidity problems.
High accounts receivable: may signal difficulty in collecting payments.
Negative equity : can be a sign of financial distress.
Overstated intangible assets: may artificially inflate value.
By keeping an eye on these, you can avoid companies with weak financial foundations.

Enjoying the content? Don’t miss out on more exclusive insights and analyses. Subscribe now and stay updated.
7. Comparing to Industry Benchmarks:
A company’s balance sheet should always be analyzed relative to its industry peers.
What’s considered a “good” debt-to-equity ratio or current ratio varies across industries. For example:
A tech company with high cash reserves may have minimal debt.
A utility company may have high debt but stable cash flows to support it.
A retail company may have large inventory, but the turnover rate matters more.
Understanding industry norms helps put financial metrics in context.
8. Conclusion: Think Like a Pro Investor
A balance sheet tells a story about a company’s financial health, the risks it carries, and its potential to generate value for investors.
Professional investors focus on liquidity, leverage, efficiency, and industry benchmarks to get a full picture of financial health.
By mastering these concepts, you’ll be able to separate strong companies from weak ones - and make better investment decisions.
Next time you look at a company’s balance sheet, go beyond the surface and ask:
Is this company financially strong?
Can it weather downturns?
Is it using its assets efficiently?
With this mindset, you’ll be well on your way to analyzing balance sheets like a pro investor.
See you next time,
Jimmy
Disclaimer
As a reader of Jimmy’s Journal, you agree with our disclaimer. You can read the full disclaimer here.
Great piece
Pretty comprehensive for a newbie!