

How To Build a DCF Valuation Model Like a Pro Investor
Learn how to build your own DCF Valuation Model like a pro in just 10 minutes...
Hi, Investor 👋
I’m Jimmy, and welcome to another edition of our newsletter. Today’s post is a practical one - and one I’ve been meaning to write for a while.
We’re breaking down how to build a DCF valuation model from scratch - the same tool I’ve used for years to estimate what a business is really worth.
In case you missed it, here are some recent insights:
Subscribe now and never miss a single report:

After 8 years working as an equity analyst, if there’s one thing I’ve done a lot during this time, it’s building DCF valuation models.
This is the fundamental method of valuing a company and it’s widely used by analysts and portfolio managers all over the world.
Although it may look scary at first, the concepts behind it are very simple - and the model can (and should) be adapted based on your needs.
My goal with this article is to show you how to build a DCF your own way, aligned with your investment process - but with the depth the stock market demands.
Before we jump into Excel, let’s walk through the key building blocks…
What’s a DCF Model?
A DCF (Discounted Cash Flow) model is one of the most common tools used to estimate how much a company is worth.
It works by forecasting the company’s future cash flows and bringing them back to today’s value - based on the idea that money today is worth more than money in the future.
Valuation Fundamentals:
Valuing a company relies on a few key concepts.
Our goal here isn’t to cover them in full detail - just a quick refresher.
Otherwise, we’d run out of space before even getting to the step-by-step guide on how to build your own model…
1. Free Cash Flow (FCFF):
Free Cash Flow to the Firm (FCFF) is the foundation of any DCF. It represents the actual cash a company generates after operating expenses, taxes, reinvestments (Capex), and changes in working capital - before any financing decisions.
In short, it’s the cash available to both debt and equity investors.
Accurate FCFF projections come from well-reasoned assumptions about:
Revenue growth
Operating margins
Investment needs (Capex)
Working capital dynamics
2. Perpetuity (Terminal Value):
Since companies don’t stop operating after 5–10 years, we calculate a terminal value to capture the long-term value beyond the forecast period.
There are two main methods to calculate terminal value:
Perpetuity growth: assumes cash flows grow at a steady rate forever (e.g. 2.5%, in line with inflation)
Exit multiple: applies a valuation multiple (e.g. 10x EV/EBITDA) to the final projected year
Terminal value often accounts for more than 50% of the total valuation - so it's crucial to be conservative.
Small changes in assumptions can lead to big shifts in outcome.
3. Cost of Capital (WACC):
To bring future cash flows to present value, we use the Weighted Average Cost of Capital (WACC).
The formula itself can be complex - but our goal here is to simplify.
Think of WACC as the minimum return an investor should expect for taking on the risk of an investment.
When the U.S. Treasury yield is around 5% per year, investors typically require:
7-10% for blue-chip companies
12-15% for small caps or riskier businesses
The difference reflects the equity risk premium - the extra return expected in exchange for higher uncertainty.
If you want, you can apply the full formula - but you’ll likely end up within this range anyway.
By discounting the projected FCFFs and terminal value with WACC, we arrive at the enterprise value - as shown in the example below:

WACC (r) = 10%
Number of periods (n) = 5
Free Cash Flow = $100 million per year
Enterprise Value = $565 million
Found this content valuable? Share it with your network! Help others discover these insights by sharing the newsletter. Your support makes all the difference!
Additionally, you need a solid understanding of how the three core financial statements - the (i) income statement, (ii) balance sheet, and (iii) cash flow statement - connect and interact.
Most Jimmy’s Journal readers are already familiar with all three.
But if you want to review the basics, here’s a link:


Building Your Own Valuation Model:
Now that we’ve reviewed the core concepts, let’s move on to building the model…
1. Macroeconomic Forecasts:
Many people say revenue projections are the first step in a DCF.
But they often skip an even more important starting point: macroeconomic assumptions.
I like to dedicate a specific section of my model just for them - because they help keep all projections grounded in reality.
Interest Rates
Inflation (PCE),
GDP growth
Total Addressable Market (TAM)
All of these should be part of the equation…
Institutional sites like JP Morgan, Goldman Sachs, The Conference Board, and the Fed offer free access to key macroeconomic forecasts - often looking at least five years ahead.
I once had a colleague present a retail DCF to the investment committee. According to his model, the company would become larger than the entire fashion retail sector by 2028. His projections implied a 128% (!!!) market share.
Why? Because he lacked a reference point. No macro context. Just spreadsheets in a vacuum.
2. Forecasting Revenue:
There are many ways to forecast revenue, but most approaches fall into two main buckets: growth-based and driver-based.
A growth-based forecast is the simpler one. You apply a year-over-year growth rate to the company’s current revenue.
It works well for mature, stable businesses where growth is relatively predictable.
For many DCF models, this is more than enough.
A driver-based forecast goes deeper. You break revenue down into its core components - such as price × volume, number of customers, number of stores, average basket size, market share, etc.
This type of model is more complex, but also more powerful when done right.
In some cases, analysts use regression analysis or external benchmarks to map how macro factors (like GDP or interest rates) affect the company’s revenue.
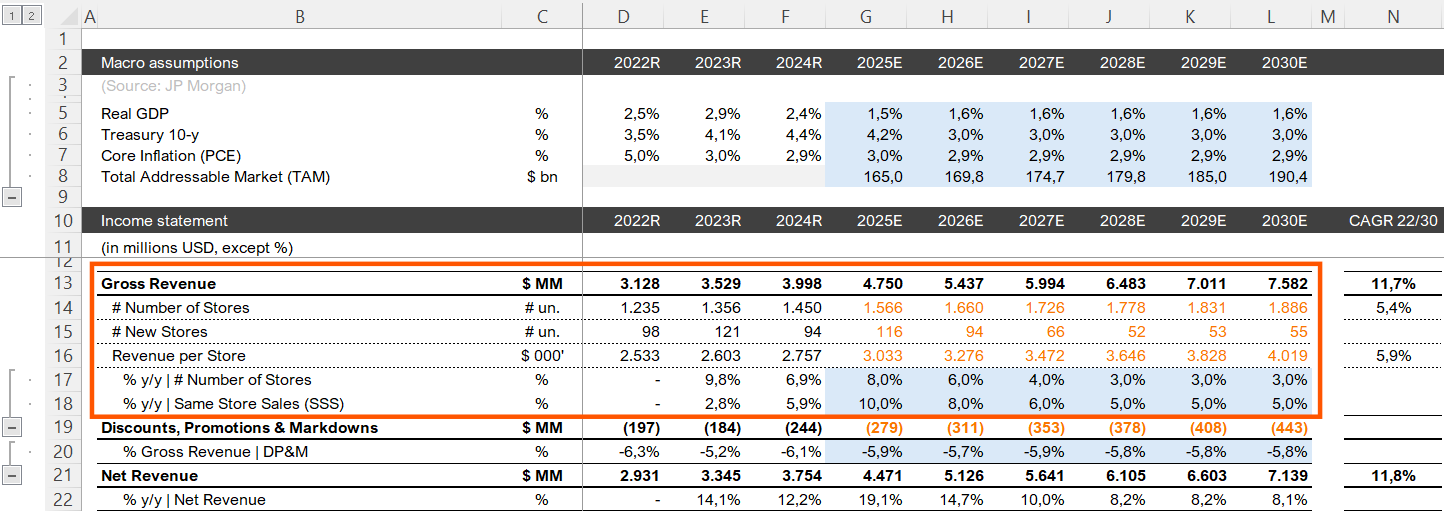
Take a look at the example above. This is a fashion retailer with $3.9 billion in net revenue reported for 2024.
Average revenue per store was around $2.7 million, across a network of 1,450 stores - including both owned and franchised units.
Now focus on how the revenue growth was projected (in blue): it’s based on new store openings going forward, plus the expected growth from existing stores - also known as same-store sales.
This level of detail is only possible because the company provides that kind of disclosure.
For a commodities business, you might project revenue based on commodity price × total volume sold.
For an equipment rental company, it could be total asset base × average rental yield.
It all depends on the business.
That’s why understanding the business model is so important - it shapes how you project future revenue.
Enjoying the content? Don’t miss out on more exclusive insights and analyses. Subscribe now and stay updated.
3. Forecasting Costs & Expenses:
Cost projections might not be as exciting as revenue growth - but they’re just as important.
This is where you model how the company’s operating structure will evolve over the next few years.
Will margins expand or shrink?
Is there operating leverage?
Is R&D expected to increase?
Will there be a new distribution center or large fixed cost investment?
These are all factors that affect cost behavior.
Most cost lines are usually projected as a percentage of net revenue. But the exact percentages - and how they change over time - should reflect your investment thesis.
If you believe the company will scale efficiently, you might project margins improving. If you expect competitive pressure or inflation in input costs, you might take the opposite view.
It’s less glamorous than revenue, but this part can make or break your valuation.
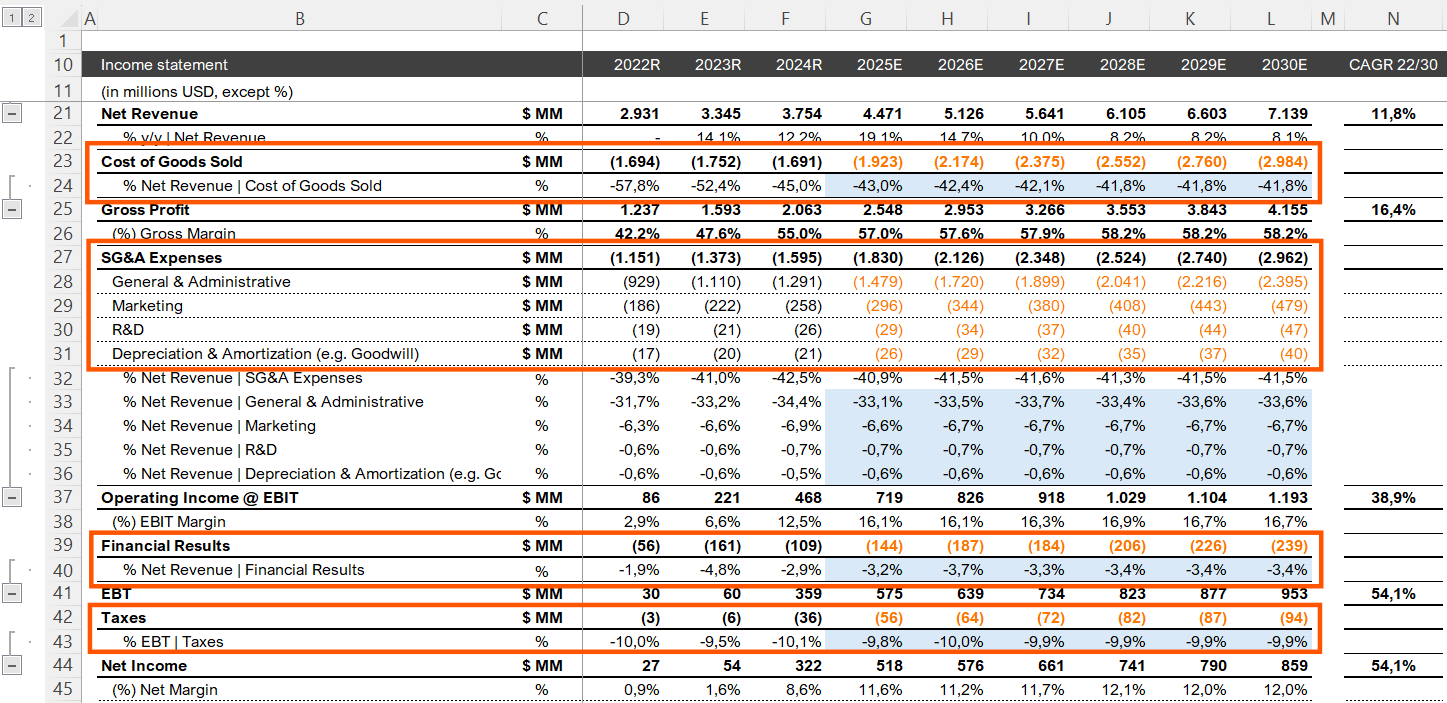
The main costs to project are:
Cost of Goods Sold (COGS): direct costs of production, such as raw materials, labor, and logistics.
Selling, General & Admin (SG&A): salaries, rent, marketing, and administrative overhead.
Research & Development (R&D): investments in innovation and product development.
Depreciation & Amortization (D&A): non-cash expense tied to asset wear and tear > affects accounting, not cash.
Taxes: applied on operating profit (EBT or EBIT, depending on model) - varies by jurisdiction and often modeled as a flat rate.
To make sure your cost assumptions are grounded in reality, consider checking:
Industry Trends and Market Projections:
Are input costs rising faster than pricing power?
Is there a new technology driving cost inflation or deflation?
Are suppliers operating with negative margins?
Management Guidance:
Many companies provide long-term targets for EBITDA margin, gross margin, and other key metrics.
Make sure your assumptions are aligned - or that you have a solid reason to differ.
Direct Competitors:
Competitors are a mirror of what your company could become - for better or worse.
Track how peers are managing costs and margins. It sets a benchmark and can help validate (or challenge) your assumptions.
4. Forecasting CAPEX and Working Capital:
After projecting revenue and costs, the next step is to estimate how much the company needs to reinvest to keep growing.
That means forecasting CAPEX (capital expenditures) and changes in Working Capital.
CAPEX:
Capex refers to investments in long-term assets - like new stores, equipment, or technology.
It’s usually one of the biggest cash outflows in a business model, and it directly impacts PP&E (Property, Plant & Equipment) on the balance sheet.
The most detailed approach is to create a separate schedule with:
Opening balance of PP&E
New investments (Capex)
Depreciation
Asset disposals
Closing balance
Most models project Capex as a % of revenue or link it to growth initiatives.
Just make sure it’s consistent with your revenue thesis.
Working Capital:
Working capital includes accounts receivable, inventory, and accounts payable. Changes in these items affect cash flow - often in subtle but important ways.
If receivables increase → less cash collected
If payables increase → more cash kept on hand
If inventory grows → cash is tied up in stock
In short:
Longer collection cycles = higher receivables = less cash
Longer payment cycles = higher payables = more cash
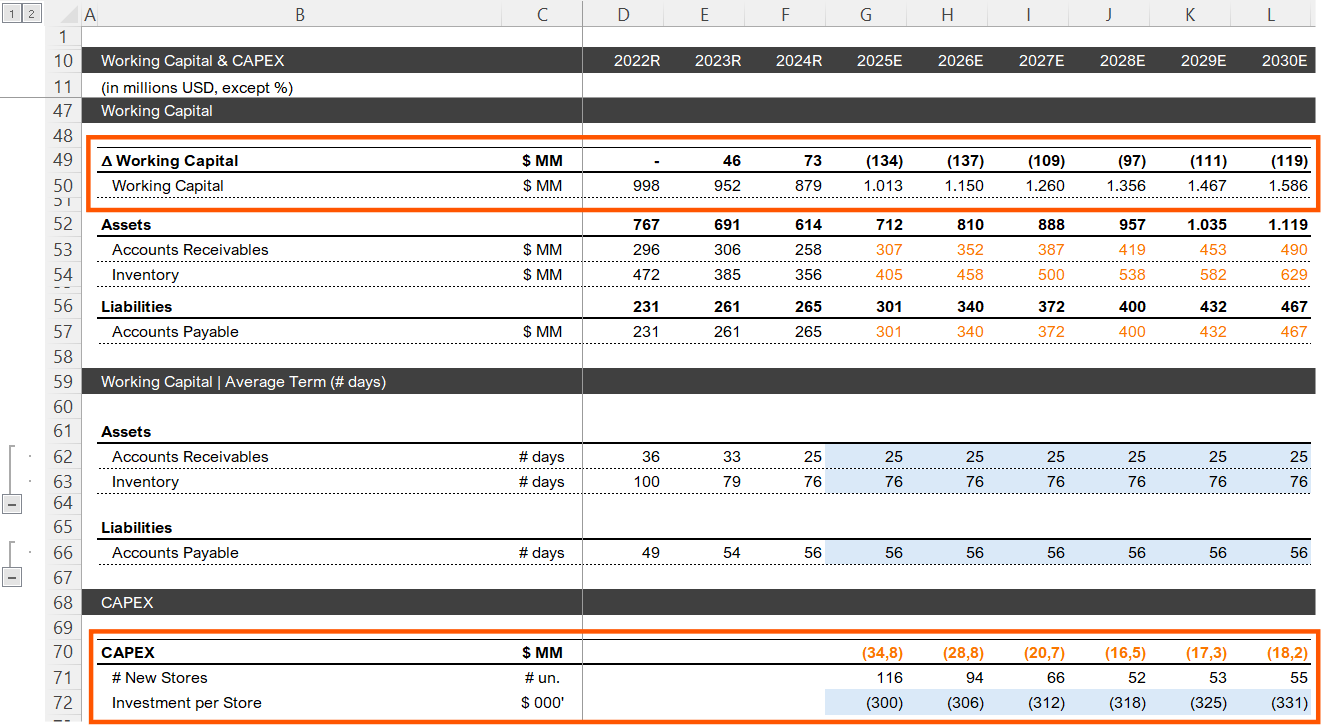
Take a look at the example above.
The company reduced its average collection period and inventory days, while extending its average payment terms.
Even with revenue growing, it reported a positive working capital delta - meaning it generated cash from its operations.
As for CAPEX, it was projected as a function of store openings.
By estimating a minimum investment per new store, you can easily calculate total CAPEX for the period.
Found this content valuable? Share it with your network! Help others discover these insights by sharing the newsletter. Your support makes all the difference!
Discounted Cash Flow (DCF):
Now we’ve arrived at the Discounted Cash Flow (DCF) section of our Excel model.
This is, in short, a summary of everything we’ve projected so far - revenue, costs, expenses, and investments - now brought back to present value.
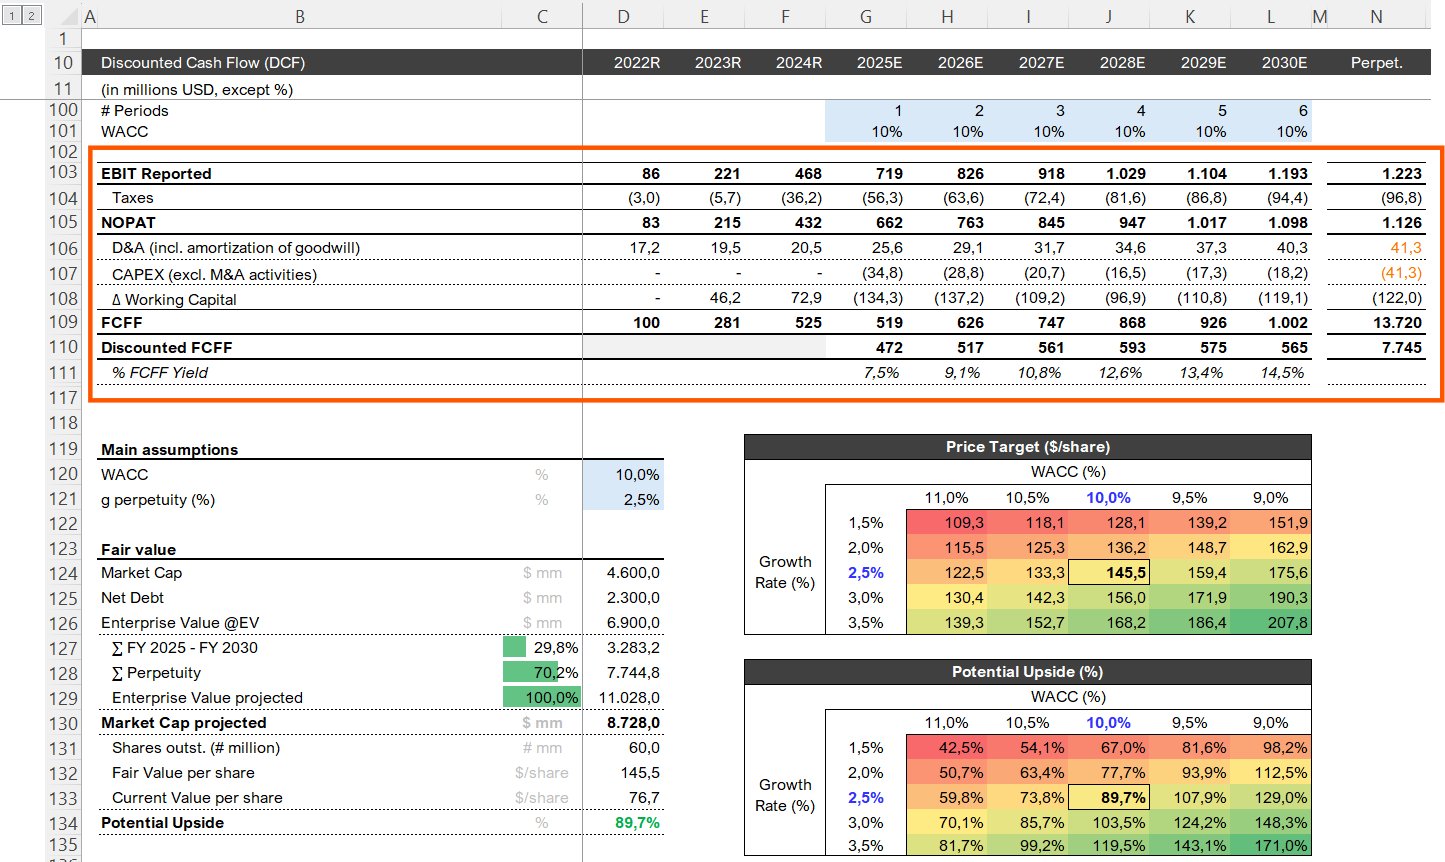
Here’s how it works, step by step:
Start by defining your WACC and perpetual growth rate, based on the company’s business model and long-term outlook.
In our example, we used a 10% WACC and
2.5% perpetual growth, roughly in line with inflation.
Next, calculate NOPAT (Net Operating Profit After Taxes): the company’s core operating profit after taxes, but before interest and financing. It isolates operating performance, regardless of capital structure.
Adjust for investments and working capital: subtract capital expenditures (CAPEX) and changes in working capital, then add back depreciation.
This gives you Free Cash Flow to the Firm (FCFF) > cash available to both debt and equity holders.
Discount each year’s FCFF using the WACC, to reflect time value and business risk.
Estimate the terminal value at the end of the projection period.
Add the present value of all projected FCFFs and the terminal value to get the enterprise value - the total value of the business.
Subtract net debt (total debt minus cash) to calculate the equity value, or market cap.
Divide the market cap by the number of shares outstanding to get the stock’s fair value.
Compare it to the current share price to decide if it’s a buy, hold, or sell.
Wrapping It All Up:
At its core, a DCF model is just a structured way to answer one big question:
How much is this business really worth - based on the cash it can generate?
Building a full DCF model from scratch can be tough - especially if you're new to valuation.
That’s exactly why I’m building a fully automated DCF Valuation Template - the same one I use in my own investment research.
✅ Dynamic revenue & cost drivers
✅ Full 3-statement integration
✅ Terminal value (perpetuity & exit multiple)
✅ Auto WACC & valuation outputs
Just plug in your assumptions - and get to a fair value in minutes.
🚨 The template launches this Sunday (July 27th) - and will be exclusively available to premium subscribers of Jimmy’s Journal.
By joining, you’ll also unlock:
Exclusive stock picks
Deep dives & business breakdowns
Proven investing frameworks
Future tools & premium templates
Direct access to comment & engage
Take advantage of our limited-time 20% OFF offer and secure early access to the DCF Valuation Template.
If you have questions, feedback, or just want to share how you approach valuation,
drop a comment below - I’d love to hear from you.
Thanks for reading this far.
I appreciate your time and curiosity.
Cheers
Jimmy
Disclaimer
As a reader of Jimmy’s Journal, you agree with our disclaimer. You can read the full disclaimer here.
Hey Jimmy, can u please share the template thanks
Love the DCF breakdown! Wish my senior guided me like you do back then.